

Best AI Tools for Data Analysis in 2026
Compare 8 tools and produce a reproducible analysis with checked calculations and stated limits.
Explore the guide
From a documented dataset to a reviewable result.
Row 1: Order A: East, revenue 100, cost 60.
Revenue
Total revenue: 450.
Row 2: Order B: East, revenue 200, cost blank.
Known costs
Recorded costs: 150 across two orders.
Row 3: Order C: West, revenue 150, cost 90.
Subset margin
Known-cost orders have a 40% gross margin.
Question: What is the overall gross margin? Do not treat a blank cost as zero.
Overall margin
The complete margin cannot yet be calculated.
Illustrative example, not a product run or measured result.
Using 450 as revenue and 150 as total cost would silently count the blank as zero. Keep the valid subset separate from the incomplete total.
8 tools. Find your starting point.
Explore a whole file

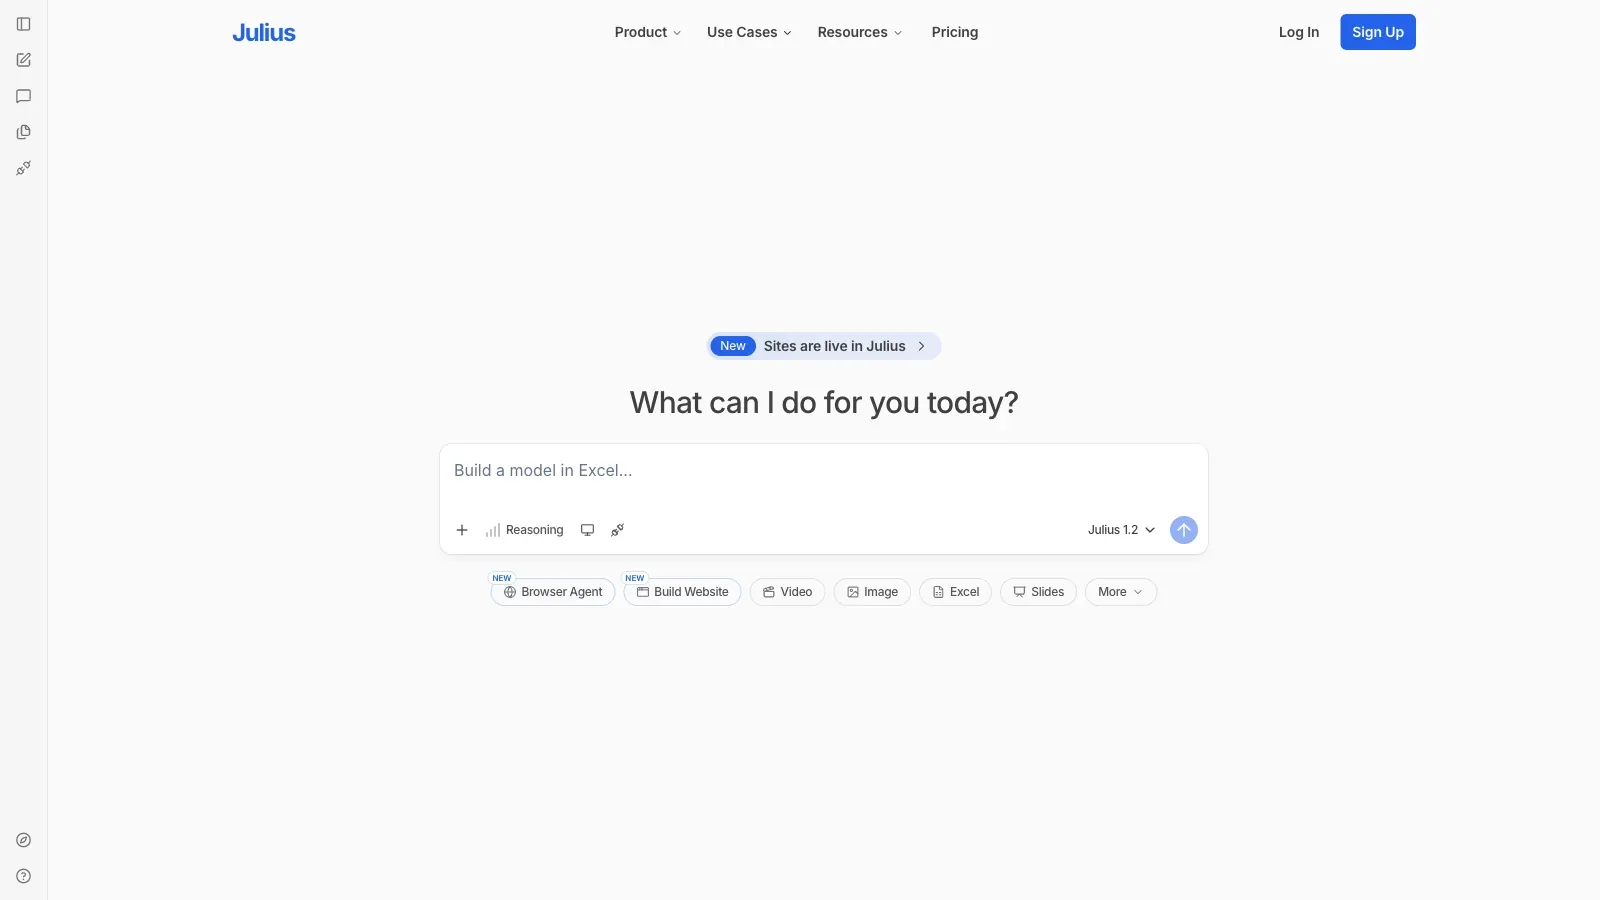
Julius AI
Start here for a question that needs cleaning, aggregation, and a chart from the same file.

ChatGPT
Use when the business question needs discussion and you want to review the analysis code.

Claude
Choose this when you need a calculated analysis file alongside a written explanation.

Gemini
Use when a dataset question can be resolved through a few chart and explanation revisions.
Work on formulas or text columns
Build an editable report
Compare what changes your decision.
8 tools for data analysis · official sources rechecked September 16, 2026
| Tool | Workflow fit | Starting input | Working output | Access | Review needed |
|---|---|---|---|---|---|
| Julius AI | Whole-file analysis | XLS, XLSX, CSV, or Google Sheets | Analysis, charts, and CSV or Excel downloads | Free daily credits; Plus $20/month | Ask to see the filters and calculation; a plausible summary can conceal excluded rows. |
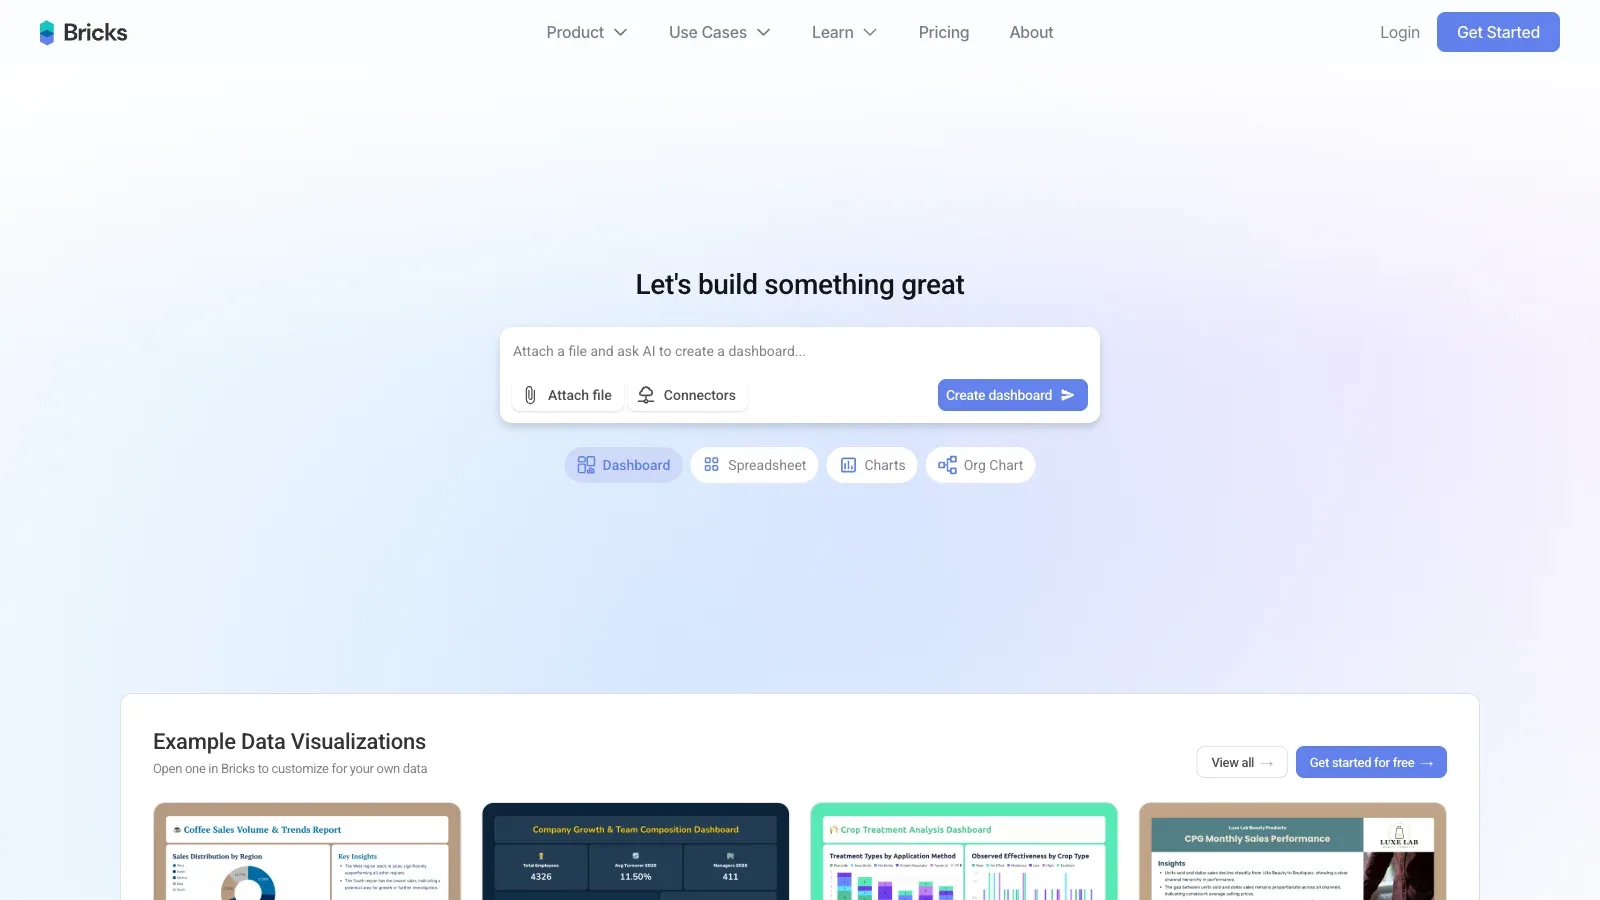
 Bricks Bricks | Dashboard from a table | Uploaded dataset data | Editable dashboards and reports | Free 20 AI messages/month; exports on paid plans | Check every filter and total before refreshing the dashboard with a new file. |
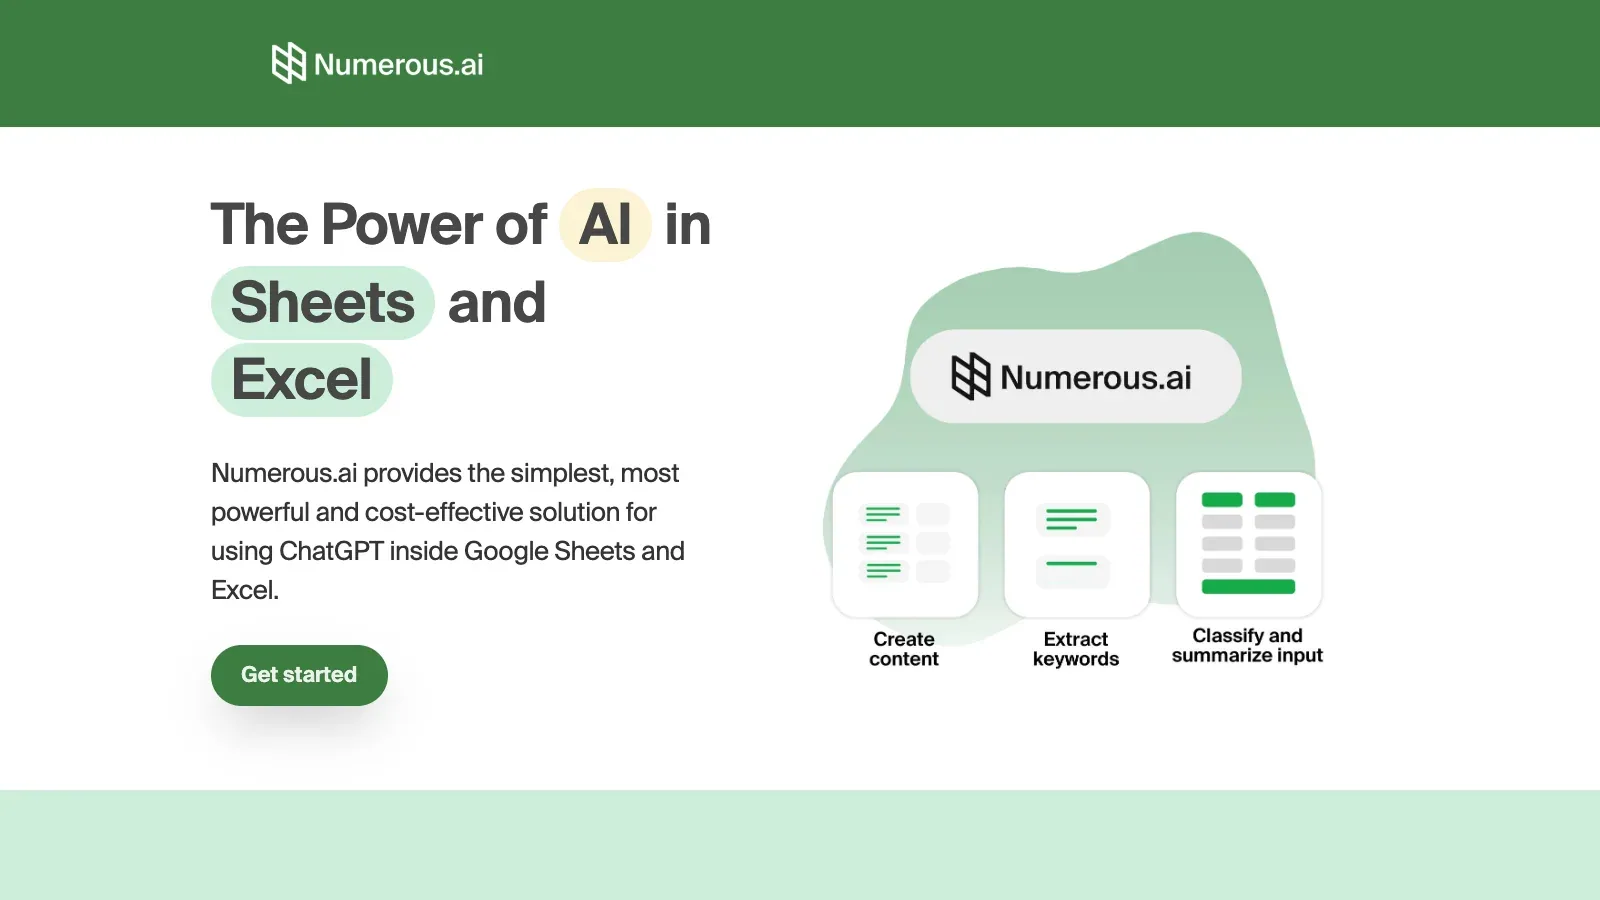
 Numerous.ai Numerous.ai | Text cleanup in cells | Cell text in Google Sheets or Excel | AI-generated cell values and formulas | Personal shown at $10/month with annual billing | Review a varied sample of labels before applying a prompt across the full column. |
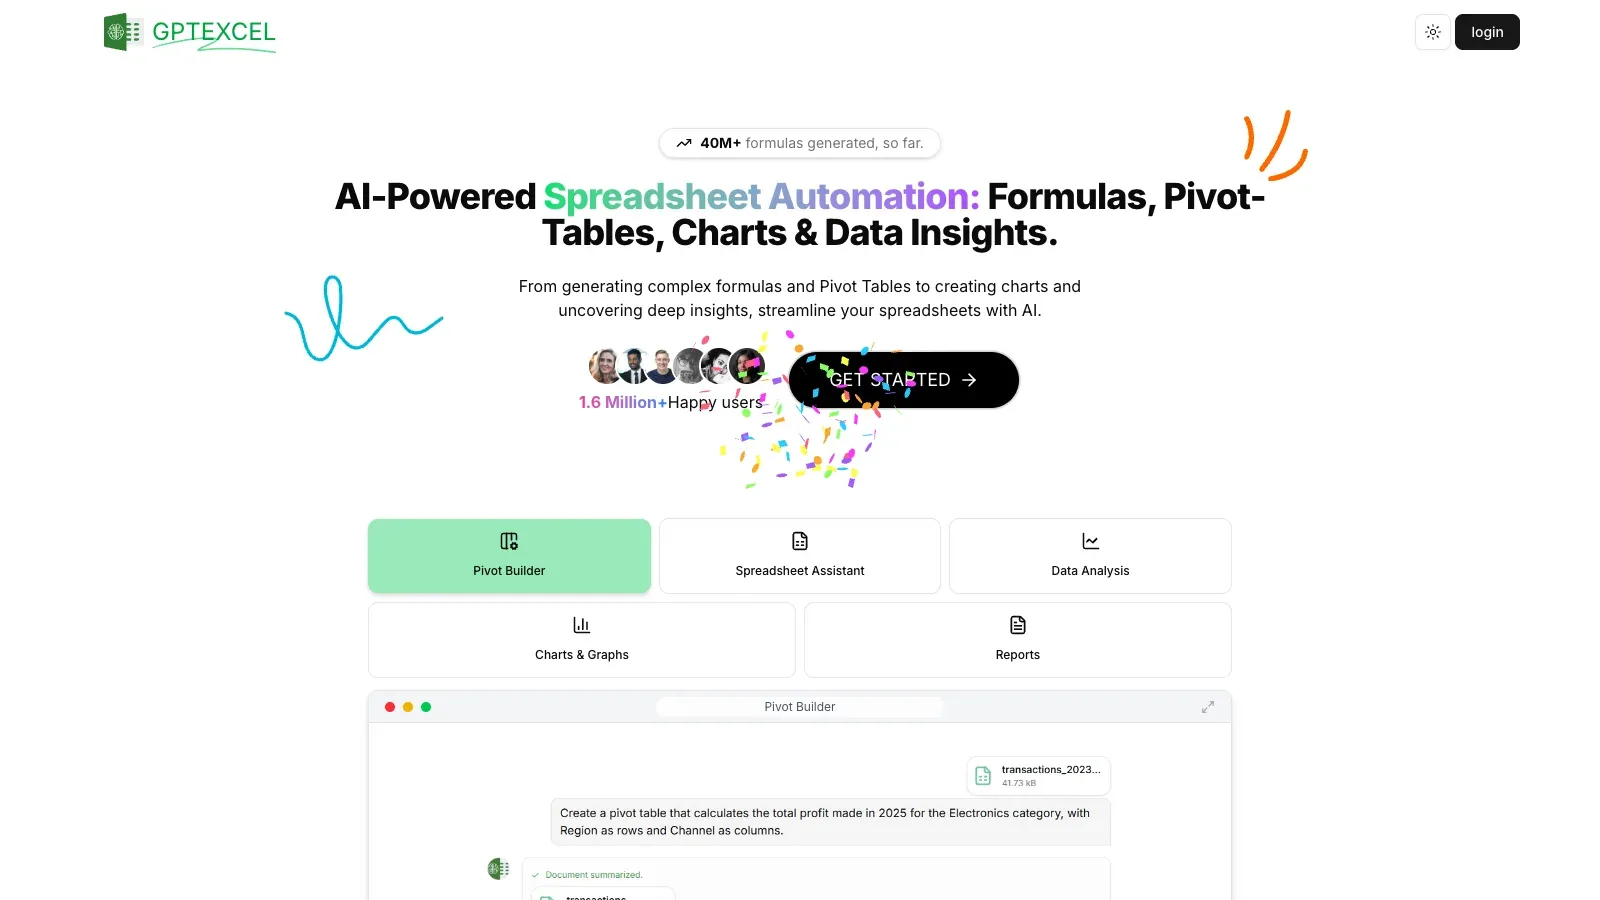
 GPTExcel GPTExcel | Formula and query assistance | Formula description or uploaded XLSX/CSV | Formulas, data chat, charts, and tables | Free; paid tiers increase file size limits | Test formulas on blanks, zero values, and edge cases before filling down. |
 Genspark Genspark | Editable analysis file workflow | Excel files and other source documents | Cell references, formulas, charts, XLSX export | Free credits; paid amounts require checkout | VBA execution, Power Query, and legacy Excel data connections are unsupported. |
| ChatGPT | Explain and inspect analysis | Excel or CSV files | Python-backed analysis and charts | Free and paid plans with different limits | Its analysis environment cannot make external web requests; supply the needed data. |
| Claude | Analysis to an editable file | CSV, TSV, and other uploaded data | Charts and downloadable XLSX with formulas | File creation on all plans; 30 MB per file | Open the downloaded analysis file and check formulas; file creation shares chat usage limits. |
| Gemini | Chart discussion from files | Uploaded datasets | Data explanations and editable chart instructions | Sign-in required; upload and usage limits apply | Large files can lose detail; check that every relevant sheet and column was read. |
A closer look at 8 tools.
Julius AI
- Choose it when
- An analyst working from CSV or Excel exports.
- Think twice when
- Ask to see the filters and calculation; a plausible summary can conceal excluded rows.
- Before you start
- Name the relevant sheets and ask for a row-count audit first.
Bricks
- Choose it when
- A team turning recurring reports into visual summaries.
- Think twice when
- Check every filter and total before refreshing the dashboard with a new file.
- Before you start
- Prepare a tidy table and decide which metric each chart should answer.
Numerous.ai
- Choose it when
- A dataset user labeling open-text responses.
- Think twice when
- Review a varied sample of labels before applying a prompt across the full column.
- Before you start
- Install the add-on and define allowed labels, including an uncertain category.
GPTExcel
- Choose it when
- A user maintaining an existing analysis file.
- Think twice when
- Test formulas on blanks, zero values, and edge cases before filling down.
- Before you start
- State the dataset application, column names, and expected sample result.
Genspark
- Choose it when
- A user combining file data with a small amount of external research.
- Think twice when
- VBA execution, Power Query, and legacy Excel data connections are unsupported.
- Before you start
- Confirm analysis file compatibility and use a desktop browser.

ChatGPT
- Choose it when
- A user exploring trends in a well-structured table.
- Think twice when
- Its analysis environment cannot make external web requests; supply the needed data.
- Before you start
- Upload the file and ask it to explain the schema before calculating.
Claude
- Choose it when
- A user preparing an XLSX handoff for further editing.
- Think twice when
- Open the downloaded analysis file and check formulas; file creation shares chat usage limits.
- Before you start
- Confirm file creation is enabled and keep individual files within the stated limit.

Gemini
- Choose it when
- A user reviewing a table in a conversational workflow.
- Think twice when
- Large files can lose detail; check that every relevant sheet and column was read.
- Before you start
- Name the sheet and request a small summary before asking for charts.

From raw rows to a checked answer.
Define the calculation
Write the question in measurable terms. For margin, state whether to use gross or net revenue, which costs count, and how to handle refunds and missing values.
Inspect the file
In Julius, upload the analysis file and identify the sheets. Ask for row counts, column types, duplicate keys, missing values, and date coverage. Resolve these issues before requesting a chart.
Calculate in stages
Approve the cleaning rules, then ask for the grouped table, calculation, and chart. Request the numerator, denominator, and excluded-row count for each percentage.
Check against the original
Recalculate a small sample in the original dataset. Compare totals before and after joins or deduplication. Investigate any difference before accepting the explanation.
Export and reopen
Download the result and open it in the destination dataset app. Check formulas, date types, filters, and chart labels. Record the source file version and cleaning rules beside the output.
Give the analysis a precise brief.
Use a small, non-sensitive sample to check that the fields are understood before uploading the full file.
QUESTION
[One decision or question]

DATA
File and sheets: [names]
One row represents: [unit]
Date range and currency: [definitions]
Key columns: [names and meanings]

RULES
Missing values: [leave unknown / exclude with counts / other]
Duplicates: [key and keep rule]
Refunds and cancellations: [treatment]

PROCESS
First report row counts, types, missing values, and duplicate keys.
Propose cleaning rules and wait before changing data.
Show the calculation and the rows excluded.
Return a grouped result table and a chart with units.
Keep observations separate from explanations of causes.
Provide an export and a short audit of changes.
Before using the result
Questions before uploading.
Should I upload a screenshot of the table?
Use the underlying CSV or analysis file when you have it. A screenshot can hide rows, cut off labels, and make precise values harder to read.
Which tool should I use for survey comments?
Numerous fits cell-level labeling in Excel or Sheets. Define the label set and review ambiguous responses before applying the same instruction to the whole column.
Can I use an AI-generated formula immediately?
Try it on a small set with a known answer, including blanks and zero values. Check references and syntax in your actual dataset application.
Why do I need a row-count check?
Filtering, joining, and deduplication can change which records contribute to a total. A row-count audit helps you locate a mismatch before interpreting the result.
Were the tools run on this example?
No. Product capabilities were checked against official sources. The three-order example is an authored calculation for explaining the review process.
Sources
Official product pages used to support the comparison above.
- Julius AI · Starting input, Working output
- Julius AI · Access
- Bricks · Starting input, Working output
- Bricks · Access
- Numerous.ai · Starting input, Working output, Access
- GPTExcel · Starting input, Working output, Access
- Genspark · Starting input, Working output
- Genspark · Access
- ChatGPT · Starting input, Working output
- ChatGPT · Access
- Claude · Starting input, Working output, Access
- Gemini · Starting input, Working output, Access