

Best AI Tools for CSV Analysis in 2026
Choose a workable CSV analysis path, then check the numbers before sharing the result.
Compare the tools
Choose by the work that follows the upload.
Keep calculations visible in a spreadsheet
Build recurring reports or data flows

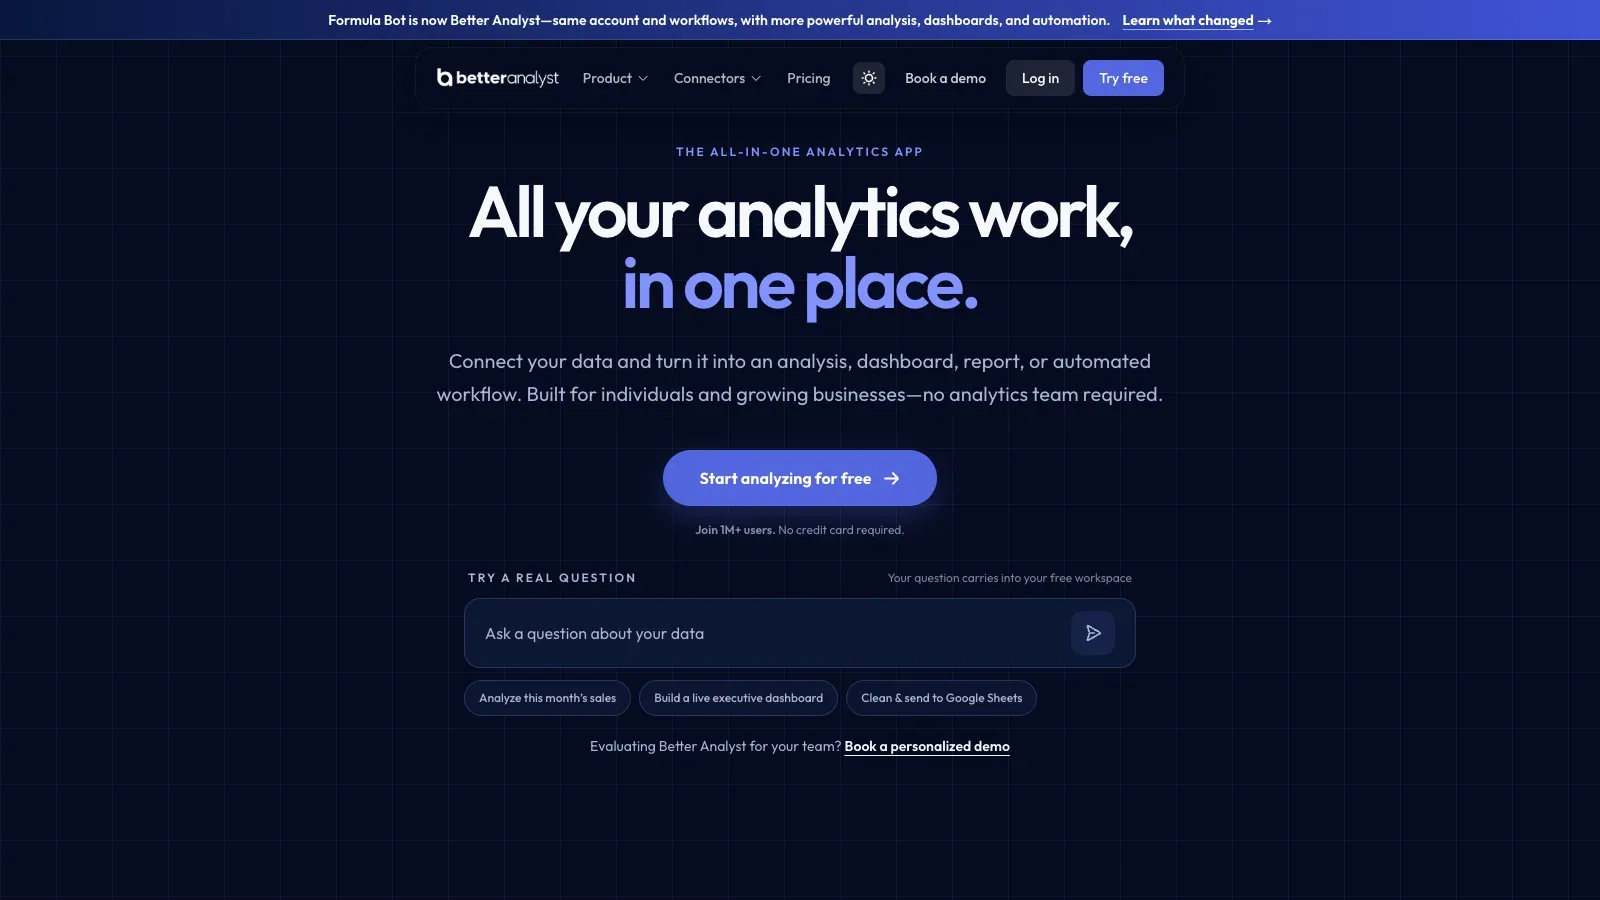
Better Analyst
Clean and reshape CSV data, inspect generated code, then automate dashboards and deliveries.

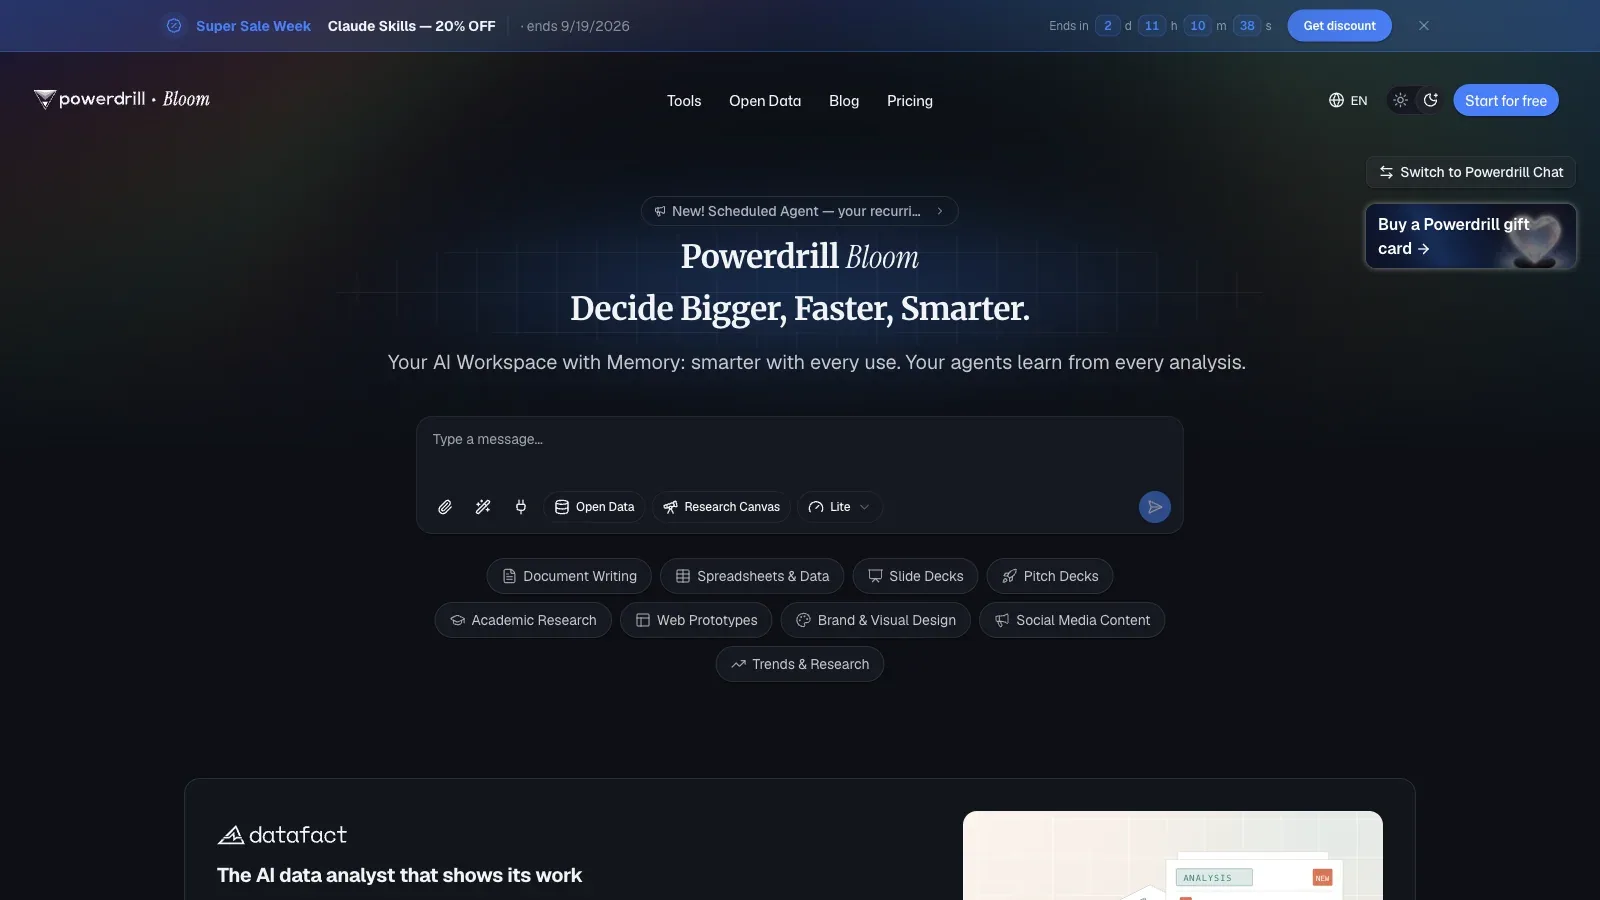
Powerdrill AI
Analyze uploaded files, add open-data retrieval, and produce charts, summaries, or office documents.

Akkio
Configure conversational analytics around a business domain and embed it in a client or internal workflow.
Process repeated rows or broader file workflows
Compare the workflow before the feature list.
Official product and pricing pages checked September 17, 2026. Promotional prices are not used as the base recurring price.
| Tool | Best workflow fit | Starting input | Typical output | Base plans |
|---|---|---|---|---|
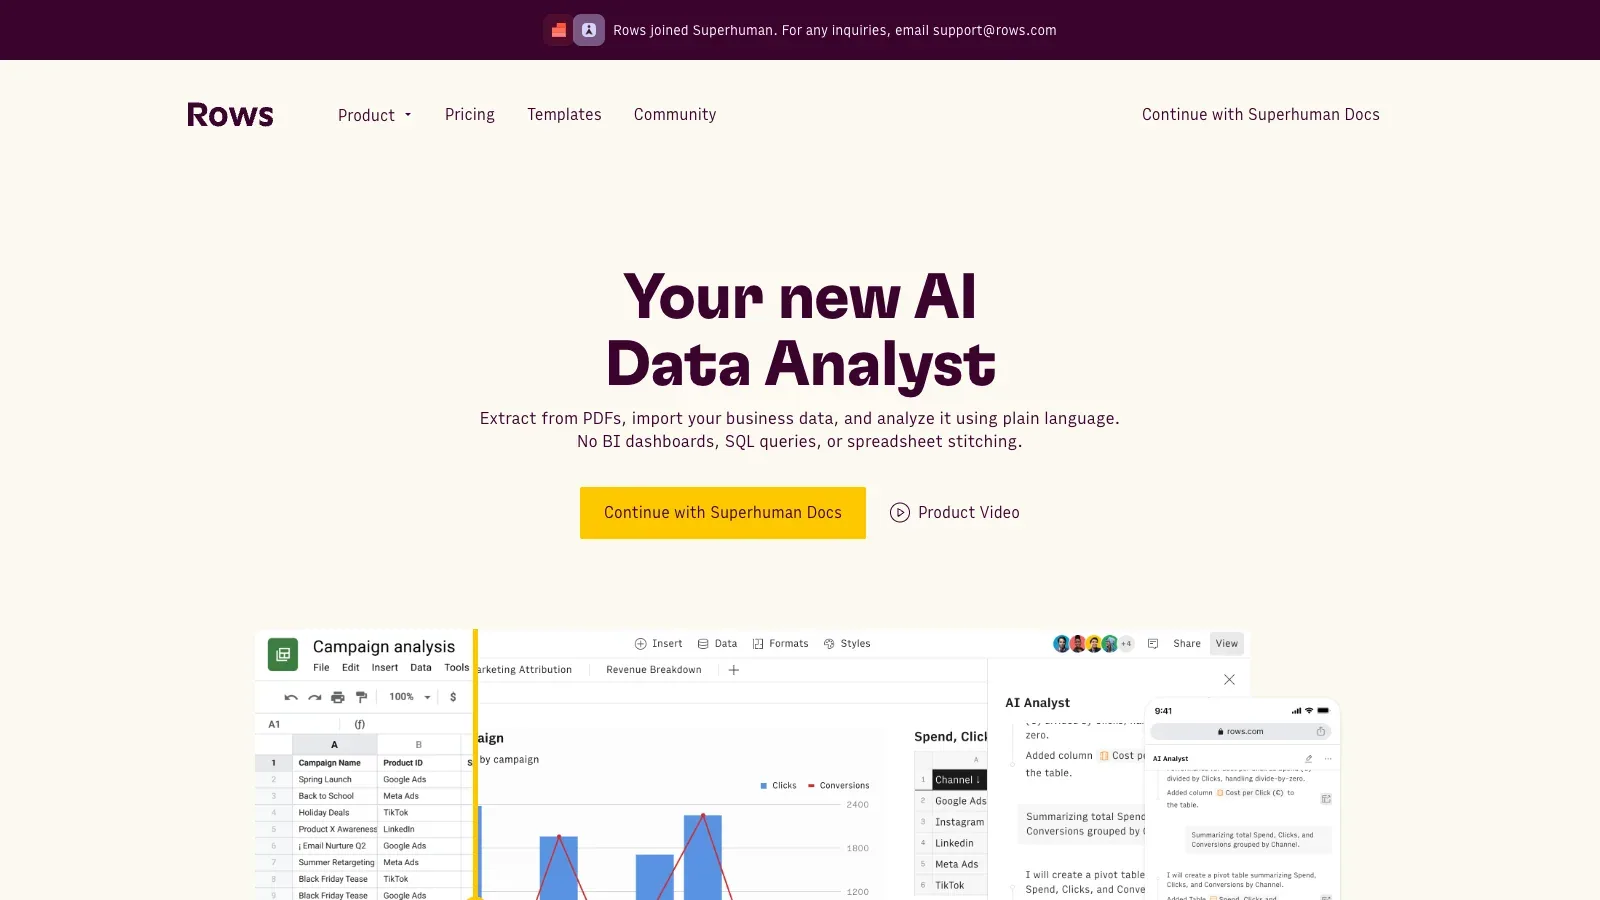
 Rows Rows | Connected reporting | CSV plus connected sources | Spreadsheet, charts, and refreshable tables | Free, Plus, Pro, Enterprise |
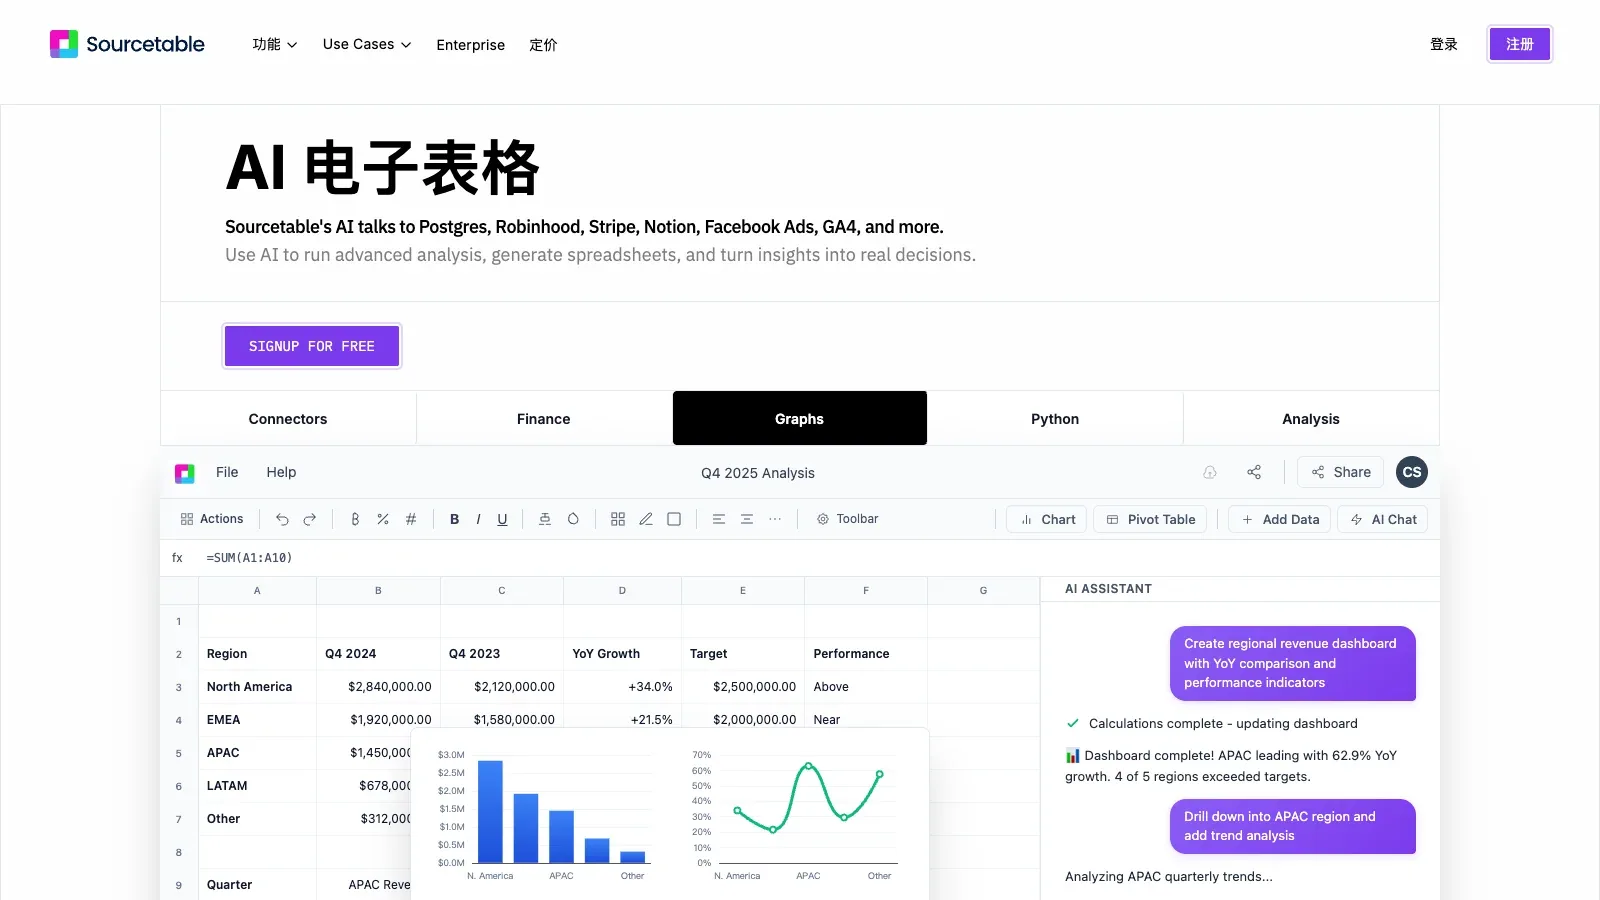
 Sourcetable Sourcetable | Mixed-file analysis | CSV, spreadsheet, PDF, JSON, or database | Workbook, calculations, and charts | Free, Pro, Max |
| Akkio | Custom analytics agents | Organization data and integrations | Conversational answers and reports | Custom enterprise quote |
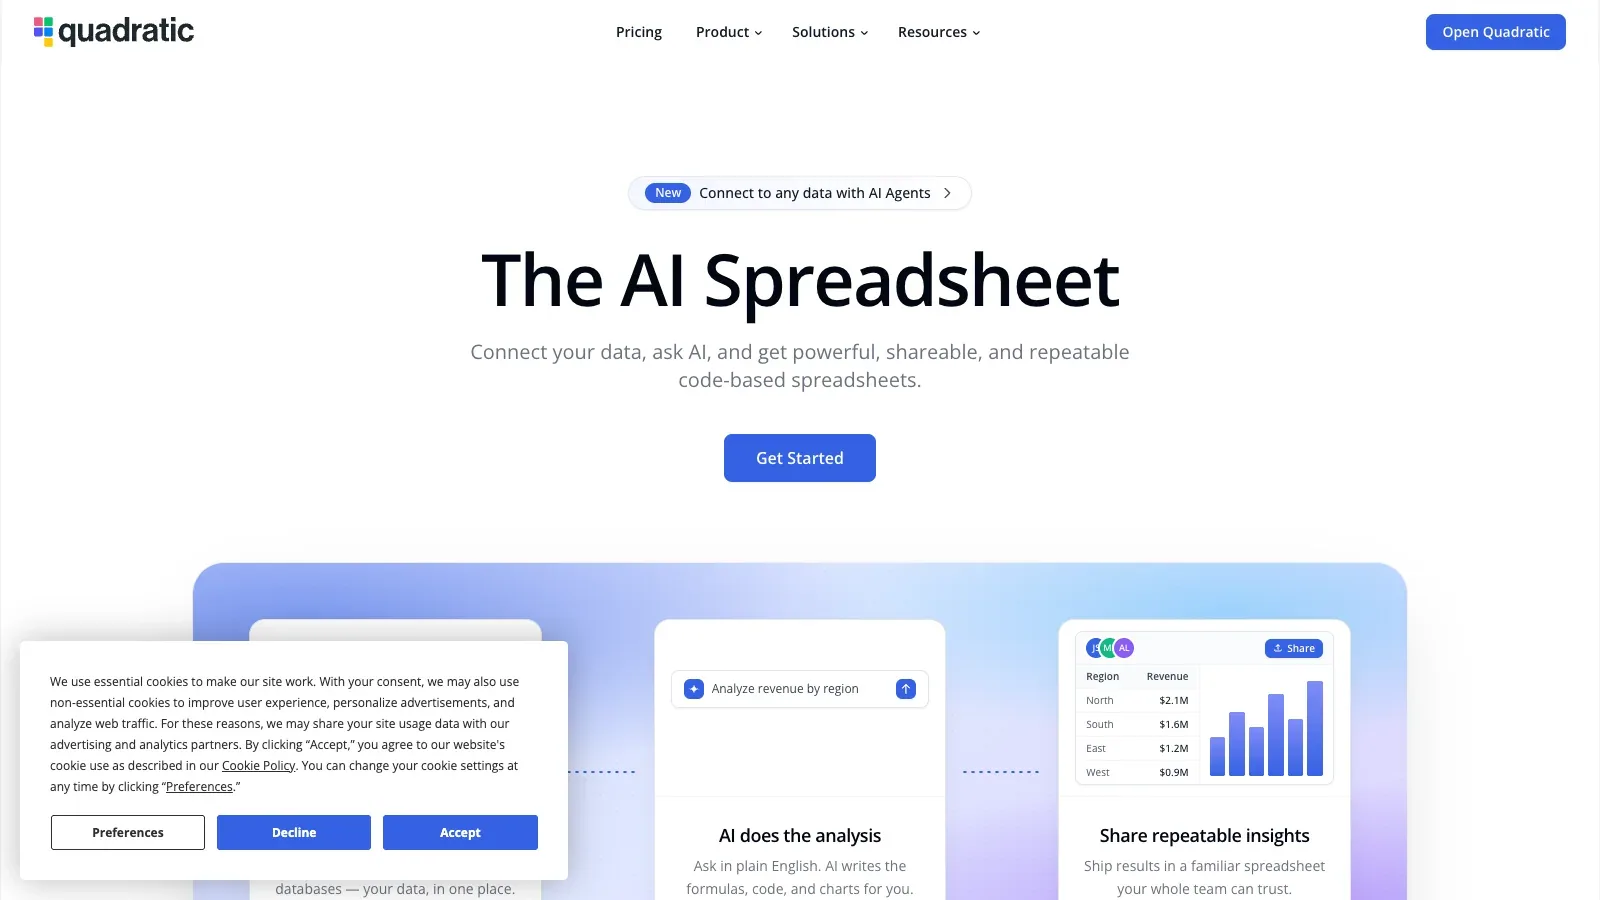
 Quadratic Quadratic | Code-visible spreadsheet analysis | CSV or connected data | Shareable code-backed workbook | Personal, Pro, Business, Enterprise |
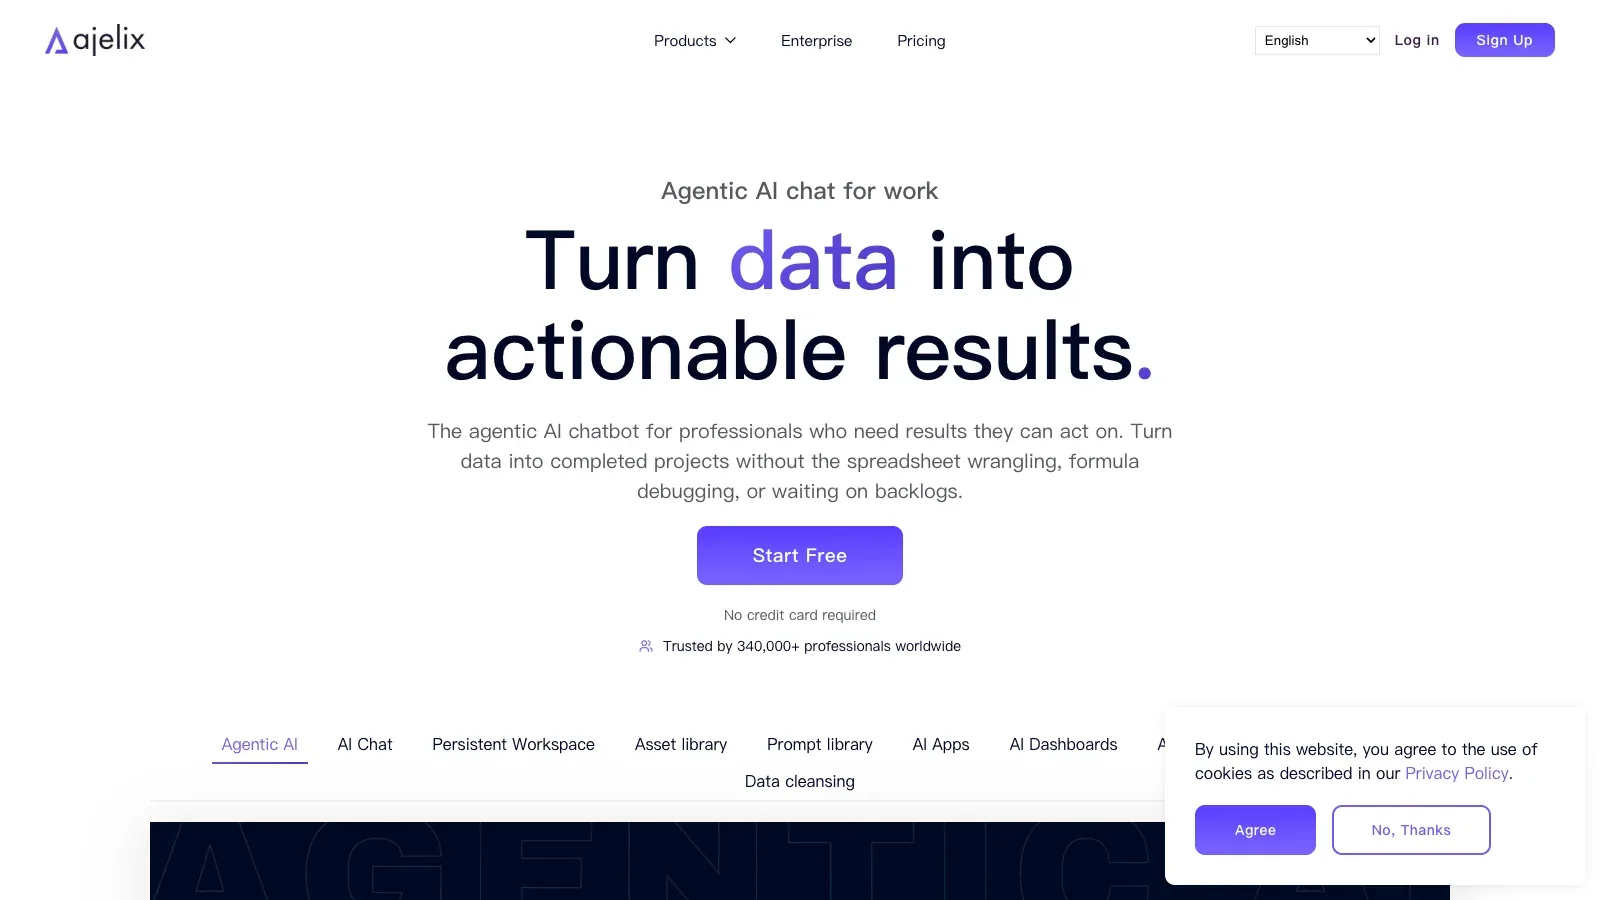
 Ajelix Ajelix | Agentic file workflow | Spreadsheet and document files | Analysis, visuals, and assets | Lite, Pro, Max, Enterprise |
| Powerdrill AI | Research and automation workspace | CSV, Excel, PDF, documents, and open data | Insights, charts, reports, and scheduled tasks | Free, Pro, Plus, Premium, Team Pro |
| Better Analyst | End-to-end analytics workflow | CSV, apps, databases, and documents | Analysis, dashboards, reports, and flows | Free, Starter, Max, Business, Custom |
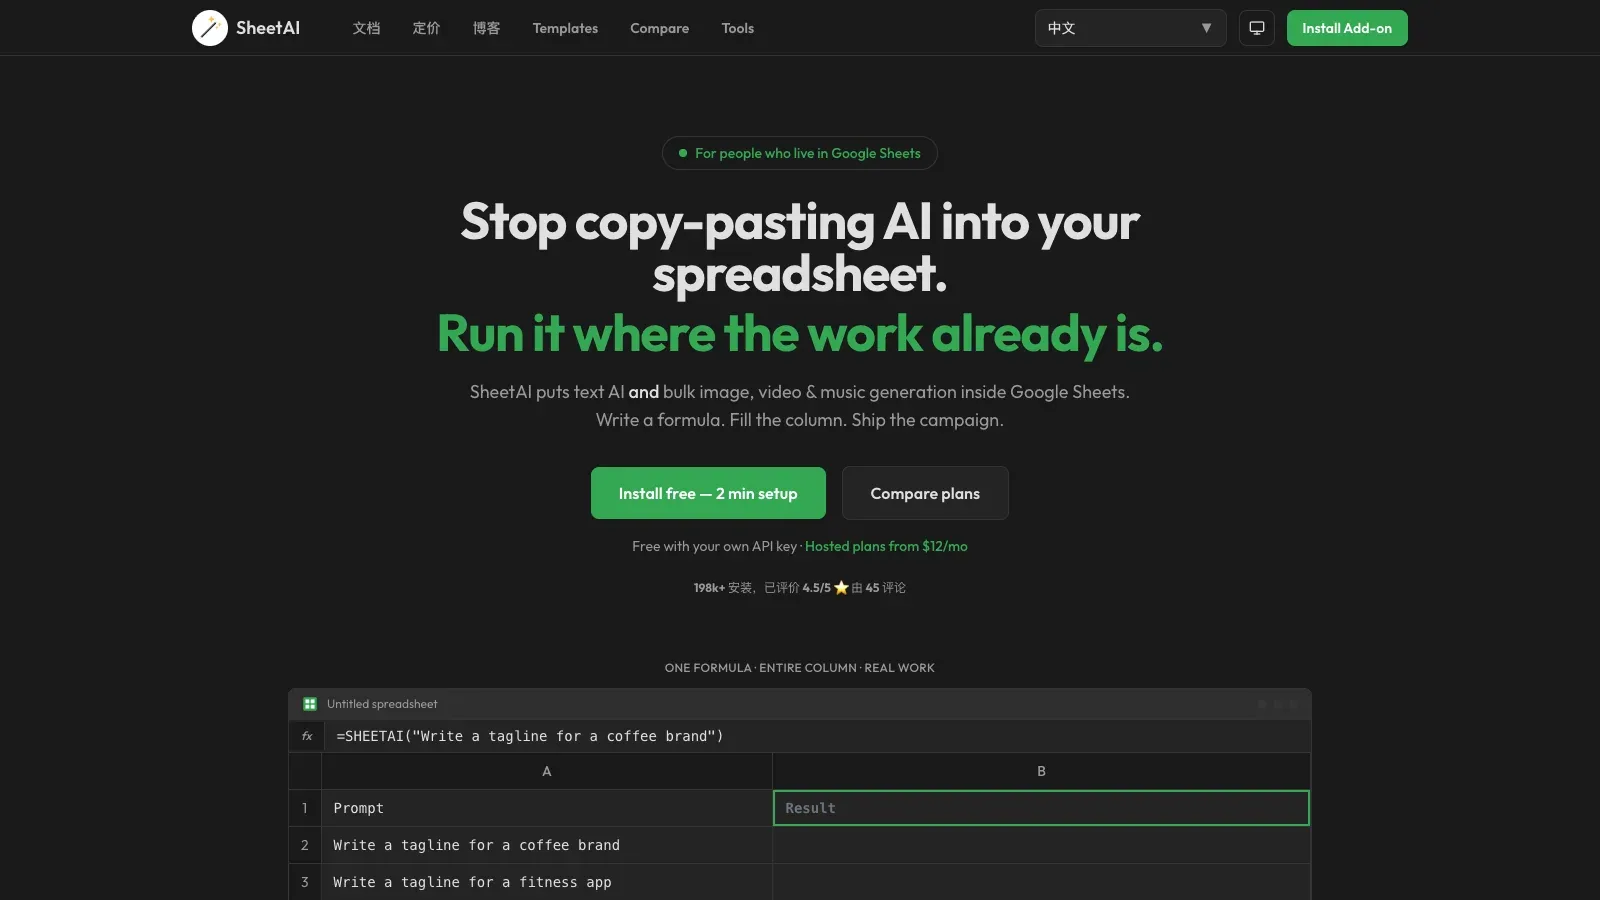
 SheetAI SheetAI | Bulk row enrichment | Google Sheets rows | Generated, classified, or extracted cells | Free BYOK, Starter, Pro |
Where each tool fits.
Rows
- Free
- $8/month
- $79/month
- Custom pricing
- Choose it when
- Teams turning file exports into recurring operational reporting.
- Think twice when
- AI tasks and import size rise by plan.
- Before you start
- Confirm the CSV size and expected refresh frequency.
Sourcetable
- Free
- $29/user/month
- $100/user/month
- Choose it when
- Analysts who want spreadsheet interaction with deeper calculation options.
- Think twice when
- AI work consumes plan credits.
- Before you start
- Estimate credit use and confirm every required source format.
Akkio
- Custom pricing
- Choose it when
- Organizations buying a customized analytics platform.
- Think twice when
- Pricing requires a sales conversation.
- Before you start
- Define the data sources, deployment model, and users before requesting a quote.

Quadratic
- Free
- $18/user/month
- $36/user/month
- Custom pricing
- Choose it when
- People who want visible calculations without leaving a spreadsheet interface.
- Think twice when
- Code-backed flexibility still requires someone to review generated logic.
- Before you start
- Choose one metric that can be independently recalculated.
Ajelix
- $39/user/month
- $99/user/month
- $199/user/month
- Custom pricing
- Choose it when
- Users whose spreadsheet workflow also produces assets or presentations.
- Think twice when
- File and workspace limits vary sharply by tier.
- Before you start
- Measure the source file and expected workspace footprint.
Powerdrill AI
- Free
- $199/year
- $399/year
- $1,990/year
- $199/seat/year
- Choose it when
- Researchers and operators who need more than a single spreadsheet result.
- Think twice when
- Credits and scheduled-task allowances govern sustained use.
- Before you start
- Separate recurring tasks from one-off analysis before choosing a tier.
Better Analyst
- Free
- $20/month
- $40/user/month
- $80/user/month
- Custom pricing
- Choose it when
- Small businesses that need an end-to-end analytics workspace.
- Think twice when
- Connected sources, automated dashboards, and flow frequency depend on plan.
- Before you start
- Count the data sources, dashboards, and scheduled deliveries needed.
SheetAI
- Free
- $12/month
- $29/month
- Choose it when
- Google Sheets users processing many similar rows.
- Think twice when
- Bring-your-own-key usage incurs provider costs; hosted plans have usage constraints.
- Before you start
- Test ten representative rows and inspect structured outputs before filling the whole column.
The guide compares documented workflows and access, not benchmarked answer quality.
A defensible CSV review in five passes.
Profile the file before prompting
Check headers, row count, keys, missing values, types, units, and date formats. Save the original untouched.
Ask one bounded question
State the metric, grouping, filters, and period. Require the tool to show its transformation or code.
Reconcile the result
Compare row counts and totals with the source. Inspect edge cases and independently calculate one material number.
Build the smallest useful visual
Choose a chart that answers the decision question and label the units, filters, and baseline.
Package the audit trail
Export the result with the source date, prompt, assumptions, exclusions, and unresolved issues.
A sales export becomes a checked exception report.
File: sales-export.csv with 18,420 rows from the billing system.
Cleaned table
Currency is normalized, refund handling is explicit, and removed rows are counted.
Question: Which regions missed the monthly renewal target?
Exception chart
Only regions below the documented target are shown, with currency and period labels.
Known issue: Refund rows use negative amounts and the export mixes two currencies.
Open issue
Three rows lack a region and stay outside the regional comparison.
Authored workflow example; no product run or performance claim is represented.
The useful output is not the first chart. It is a result that another person can reproduce and challenge.